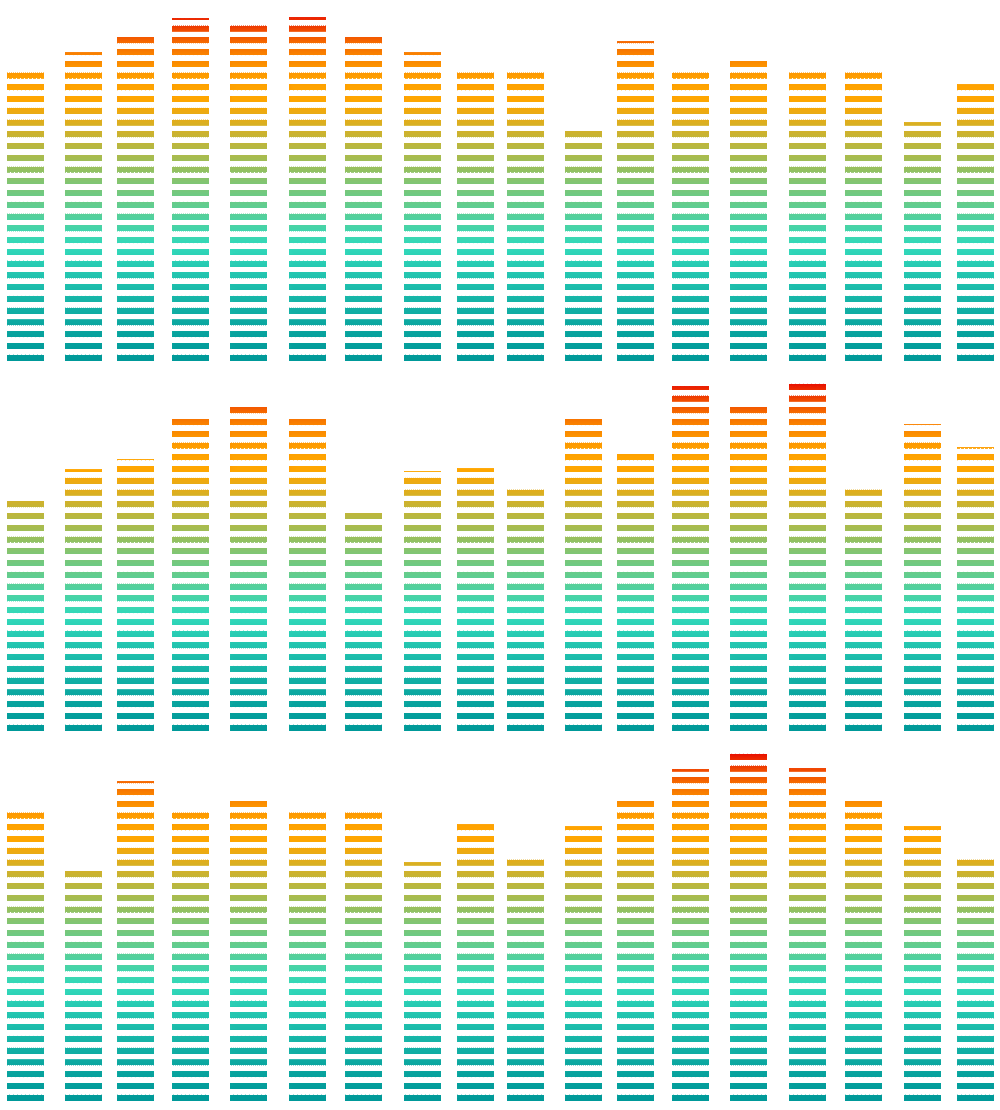



The Mineral Turpentine Oil Price Trend showed a sharp upward movement in the second quarter of 2026 as rising crude oil costs, limited feedstock availability, and shipping disruptions affected major markets around the world.
Between April and June, Mineral Turpentine Oil (MTO) prices increased significantly across India, the United Kingdom, the UAE, Indonesia, and South Africa. The quarterly increase ranged from 51% to 65% compared with the first quarter, with the UAE recording the strongest rise.
However, prices began correcting in June as geopolitical tensions eased, shipping conditions improved, and the availability of crude oil and naphtha gradually recovered.
Please Submit Your Query For MTO Price Trend, Market Analysis and Forecast: https://www.price-watch.ai/book-a-demo/
Understanding Mineral Turpentine Oil and Its Market Importance
Mineral Turpentine Oil is a petroleum-derived solvent widely used in paints, varnishes, coatings, printing inks, and industrial cleaning applications. It is also used in certain rubber-processing operations and other manufacturing activities where a suitable solvent is required. Its ability to dissolve oils, resins, and other materials makes it a useful product for several industrial and commercial applications.
The production cost of MTO is closely connected to the availability and price of crude oil and refinery feedstocks. The product is generally obtained from suitable petroleum distillate fractions, including kerosene-range streams, followed by refining and treatment processes that help achieve the required quality.
This connection with the petroleum industry makes the MTO market sensitive to changes in energy prices, refinery operating rates, transportation costs, and international trade conditions. When crude oil supplies become expensive or refinery operations are disrupted, manufacturers may face higher production costs. These increases can eventually reach distributors, importers, and end users.
The second quarter of 2026 provided a clear example of how quickly these factors can influence the market. Geopolitical tensions involving Iran and Israel created uncertainty around crude oil movements, tanker operations, and shipping through the Strait of Hormuz. These developments increased pressure on the supply chain and contributed to a strong rise in MTO prices across several regions.
Mineral Turpentine Oil Price Trend in Q2 2026
The global Mineral Turpentine Oil market experienced an unusually strong price increase during Q2 2026. Compared with the previous quarter, average prices rose by approximately 51% to 65% across the five markets covered in this analysis.
The increase was not caused by a single factor. Instead, several developments occurred at the same time. Crude oil and naphtha supplies became more difficult to manage, refinery feedstock availability tightened, and shipping companies faced higher insurance premiums and transportation expenses. In some markets, uncertainty about future supplies also encouraged buyers to replenish their inventories earlier than usual.
April was particularly important because supply concerns remained high. Refiners and traders had to manage higher input costs while dealing with uncertainty over cargo movements. Buyers in the paints, coatings, and industrial solvent sectors continued to require MTO, which made it difficult for prices to fall quickly.
The Mineral Turpentine Oil Prices remained elevated through much of this period as suppliers passed on some of the additional costs to customers. Import-dependent markets faced an extra burden because their final purchase prices included international freight, insurance, handling, and other import-related expenses.
Conditions began changing in May when geopolitical risks showed signs of easing. Shipping routes and feedstock movements gradually improved, allowing market participants to become more confident about supply availability. By June, prices had moved down from their quarterly peaks as refinery operations and trade flows began to normalize.
This correction did not mean that every market immediately returned to its earlier price level. The speed of the decline depended on local inventory levels, the timing of incoming shipments, purchasing activity, and the extent to which earlier cost increases had been passed through the supply chain.
Mineral Turpentine Oil Prices in India
India recorded an average increase of approximately 55% in MTO export prices during Q2 2026 compared with Q1. The assessment covered export prices on an FOB Nhava Sheva basis for material with a density of 770–800 kg/m³.
The rise in the Mineral Turpentine Oil Price Trend in India was closely linked to higher crude oil procurement costs and tighter availability of naphtha and kerosene-range feedstocks. The geopolitical situation created additional uncertainty for refiners, particularly as international crude movements and shipping expenses became more difficult to predict.
During April, prices remained elevated as refinery feedstock costs increased and export-grade supply became tighter. At the same time, demand from paint thinner manufacturers, printing ink producers, and rubber-processing businesses continued to support market activity.
For Indian buyers and sellers, the situation highlighted the importance of monitoring both domestic refinery conditions and international petroleum markets. Even when demand remains relatively stable, higher feedstock costs can place upward pressure on solvent prices.
By May, improving geopolitical conditions began supporting a gradual recovery in feedstock availability. Refinery operations and supply allocation started to stabilize, reducing some of the pressure that had developed earlier in the quarter.
In June, MTO prices in India corrected from their quarterly highs. Improved crude oil and naphtha availability, together with more stable refinery operations, helped ease supply concerns. However, the overall quarterly increase remained substantial, showing how strongly external energy-market developments can affect petroleum-derived solvents.
Mineral Turpentine Oil Price Trend in the United Kingdom
The United Kingdom recorded an average MTO price increase of approximately 52% in Q2 2026 compared with the previous quarter. The assessment covered import prices on a CIF Southampton basis for material with a density of 770–800 kg/m³.
As an importing market, the UK was affected by both product availability and the cost of transporting material from international suppliers. Higher freight charges, increased marine insurance premiums, and uncertainty surrounding tanker routes raised the overall cost of imported MTO.
Prices remained firm through April as buyers faced uncertainty about shipment schedules and replacement costs. Paint manufacturers, coating producers, and industrial solvent users continued to require the product for their regular operations. This steady consumption made supply interruptions more significant for the market.
When importers are unsure whether future shipments will arrive on time, they may become more cautious about inventory management. Some buyers may also seek to replenish stocks before further price increases occur. Such purchasing decisions can add pressure to an already tight market.
Conditions improved gradually during May as shipping and feedstock flows began to stabilize. By June, the UK market recorded a decline from its quarterly peak as freight premiums moderated and upstream supply conditions improved.
The experience of the UK market demonstrates that the price paid by an importer depends on more than the product's refinery-gate value. International transportation, insurance, delivery timing, and local inventory conditions can all influence the final landed cost.
Mineral Turpentine Oil Prices in the UAE
The UAE recorded the largest average increase among the five markets covered in this analysis, with MTO prices rising approximately 65% in Q2 2026 compared with Q1. The assessment covered CIF Jebel Ali import prices for material with a density of 770–800 kg/m³.
The market faced significant uncertainty as geopolitical tensions affected regional shipping conditions, tanker insurance costs, and the reliability of trade through the Strait of Hormuz. These developments created additional challenges for the movement of crude oil and the feedstocks used in petroleum refining.
During April, higher freight and insurance expenses combined with concerns about feedstock availability to push prices upward. Buyers and suppliers had to account for the possibility of delayed shipments and higher replacement costs.
Demand from paint thinner manufacturers and other solvent-consuming industries remained an important part of the market. When demand continues while the availability of incoming material becomes less certain, sellers may have greater difficulty offering products at lower prices.
In May, improving geopolitical conditions helped reduce some of the uncertainty surrounding trade flows. The movement of feedstocks and finished products began to stabilize, although the market still had to adjust to the earlier increase in costs.
By June, MTO prices in the UAE declined significantly from their quarterly peak as tanker operations improved and the availability of crude oil and naphtha became more stable.
The UAE's performance shows how shipping conditions can have a strong influence on regional solvent prices. Even when a market has access to established trading and logistics networks, disruptions affecting important maritime routes can increase costs and create uncertainty for importers.
Mineral Turpentine Oil Price Trend in Indonesia
Indonesia recorded an average increase of approximately 51% in MTO prices during Q2 2026 compared with Q1. The assessment covered CIF Jakarta import prices for material with a density of 770–800 kg/m³.
The increase was mainly associated with tighter global feedstock availability, higher energy-related expenses, and uncertainty surrounding crude oil transportation. These factors affected the economics of refining and contributed to higher import costs.
During April, MTO prices remained strong as buyers faced elevated replacement costs and uncertainty over the availability of future shipments. Demand from paint thinner manufacturers and rubber-processing businesses continued to support consumption.
For Indonesian importers, the combination of higher international prices and shipping expenses created additional pressure on purchasing budgets. When the cost of imported raw materials rises sharply, businesses may need to reconsider procurement schedules, manage inventories more carefully, or review their selling prices.
The market began showing signs of improvement during May as feedstock availability gradually recovered and geopolitical risks eased. Better supply conditions helped reduce some of the concerns that had supported the earlier price increase.
In June, MTO prices declined from their quarterly highs. More stable refinery operating rates and improved crude oil and naphtha availability helped the market move toward a better balance between supply and demand.
Indonesia's experience during the quarter demonstrates how international developments can influence local industrial input costs, particularly when buyers depend on imported material.
Mineral Turpentine Oil Prices in South Africa
South Africa recorded an average increase of approximately 51% in MTO prices during Q2 2026 compared with Q1. The assessment covered CIF Durban import prices for material with a density of 770–800 kg/m³.
The increase was influenced by tighter availability of petroleum feedstocks and higher transportation costs. Geopolitical tensions affected long-distance tanker routes and increased uncertainty around the timing and cost of international shipments.
During April, import costs remained elevated as freight expenses and limited supply availability placed pressure on the market. Demand from paint, varnish, and industrial solvent manufacturers continued to support consumption.
For import-dependent markets, transportation expenses can have a noticeable effect on the final cost of a product. Even when the price of the material itself begins to stabilize, previously booked shipments and higher freight charges may keep delivered prices elevated for some time.
Conditions gradually improved during May as shipping risks eased and feedstock availability became more reliable. This helped importers gain a clearer understanding of supply conditions and future purchasing requirements.
By June, MTO prices in South Africa had declined from their quarterly peaks. Better refinery output and lower shipping-related pressure supported the correction, although the market remained sensitive to international petroleum prices and future freight conditions.
The South African market illustrates why buyers should consider both global supply developments and local import expenses when evaluating solvent procurement costs.
Mineral Turpentine Oil Price Chart: What the Q2 Movement Shows
The Mineral Turpentine Oil Price Chart for Q2 2026 can be understood through three main stages: a sharp increase, a period of sustained price pressure, and a correction toward the end of the quarter.
In April, supply uncertainty and higher production and transportation costs pushed prices upward. The market reacted to concerns about crude oil availability, refinery feedstocks, and the movement of cargoes through important shipping routes.
During May, the direction of the market began to change. Easing geopolitical risks and gradually improving logistics reduced some of the concerns that had supported the earlier rally. However, prices remained influenced by existing inventory positions, replacement costs, and the timing of shipments.
June brought a clearer correction as feedstock availability improved and shipping conditions became more stable. This movement indicated that some of the earlier supply-related pressure was easing.
The chart also highlights the differences between producing and importing markets. India's FOB Nhava Sheva assessment reflected export-market conditions, while the UK, UAE, Indonesia, and South Africa were assessed on a CIF import basis. These price bases include different cost components and should not be compared as though they represent identical transaction terms.
For a more accurate market assessment, buyers should consider the product specification, density, delivery basis, location, and assessment period alongside the percentage price change.
Mineral Turpentine Oil Price Index and Key Market Drivers
The Mineral Turpentine Oil Price Index provides a useful way to understand the overall direction of market prices over time. During Q2 2026, the index movement reflected the combined effects of feedstock costs, refinery operations, shipping expenses, and industrial demand.
Crude oil was one of the main influences. When crude prices rise, the cost of petroleum-derived materials can increase, depending on refinery economics, product yields, and the availability of suitable feedstocks.
Naphtha and kerosene-range fractions were also important. MTO production depends on the availability of appropriate petroleum streams and the processing required to meet product specifications. Disruptions in these inputs can limit production flexibility and increase costs.
Shipping and insurance represented another major factor. Higher war-risk premiums and longer or less predictable shipping routes can raise the delivered cost of imported material. These expenses were particularly relevant to markets dependent on international cargoes.
Refinery operating rates also influenced supply. When refiners face feedstock shortages or adjust production in response to market conditions, the amount of material available for sale can change.
Finally, downstream demand helped determine how quickly prices responded to changing supply conditions. Paints, coatings, printing inks, and industrial solvents require a reliable supply of suitable raw materials. When consumption remains steady during a supply disruption, prices may stay elevated for longer.
Together, these factors explain why MTO prices increased so sharply in Q2 2026 and why they began correcting once supply and transportation conditions improved.
Mineral Turpentine Oil Price Forecast: What Buyers Should Watch
The outlook for MTO prices depends on the balance between petroleum feedstock costs, refinery availability, international shipping conditions, and demand from downstream industries. The correction seen in June 2026 suggests that easing supply disruptions can reduce price pressure, but it does not guarantee a sustained decline in every market.
Crude oil and naphtha prices remain important indicators to monitor. A fresh increase in energy costs could raise the cost of suitable refinery streams and place upward pressure on MTO prices. In contrast, stable feedstock supplies and improved refinery utilization could support more predictable market conditions.
Freight rates and marine insurance costs also deserve attention, particularly for importers in the UK, UAE, Indonesia, and South Africa. Changes in shipping conditions may affect landed prices even when the underlying product price remains relatively stable.
Demand from paint and coating manufacturers is another factor. If industrial activity strengthens and consumption increases, buyers may need to compete more actively for available supplies. If demand weakens, suppliers may face greater pressure to offer competitive prices.
For procurement teams, a practical approach is to review price movements regularly, compare offers on equivalent delivery terms, maintain suitable inventory levels, and avoid relying on a single market indicator. Monitoring both the Mineral Turpentine Oil Price Index and the relevant regional price assessment can help businesses understand whether a change is driven by the product market, feedstock costs, or logistics.
Any forecast should remain conditional because geopolitical developments, refinery operations, and freight markets can change quickly. The direction of future prices will depend on how these factors develop rather than on the June correction alone.
Conclusion
The Mineral Turpentine Oil Price Trend in Q2 2026 was shaped by a combination of crude oil and naphtha feedstock disruptions, refinery supply constraints, geopolitical uncertainty, and higher shipping and insurance costs. Average prices increased by approximately 55% in India, 52% in the UK, 65% in the UAE, and 51% in both Indonesia and South Africa compared with Q1.
April represented the strongest period of supply-related pressure, while improving conditions during May helped prepare the market for a correction in June. Better feedstock availability, more stable refinery operations, and easing shipping concerns contributed to the decline from quarterly peaks.
The quarter demonstrates how closely MTO prices are connected to the wider petroleum industry and international logistics. For manufacturers, importers, distributors, and procurement professionals, understanding these connections is essential for managing costs and planning purchases.
Going forward, tracking crude oil prices, naphtha availability, refinery output, freight expenses, and downstream demand will remain important for assessing market direction. A combination of regional price data, the Mineral Turpentine Oil Price Chart, and the Mineral Turpentine Oil Price Index can provide a clearer picture of changing conditions and help businesses make more informed purchasing decisions.
Please Submit Your Query For MTO Price Trend, Market Analysis and Forecast: https://www.price-watch.ai/book-a-demo/
About Price Watch™
Price Watch™ is an India-based, independent raw material price reporting agency that provides real-time price forecasts and data-driven insights into global raw material markets. Price Watch™ specializes in tracking raw material prices, analyzing market trends, and delivering timely updates on plant shutdowns, supply disruptions, capacity expansions, and demand-supply dynamics. The Price Watch™ platform empowers manufacturers, traders, and procurement professionals to make faster, smarter decisions. Leveraging AI-powered forecasting and over a decade of historical data, Price Watch™ transforms market volatility into actionable opportunity.
Futura Tech Park,
C Block, 8th floor 334,
Old Mahabalipuram Road,
Sholinganallur, Chennai, Tamil Nadu, Pincode - 600119.
????????: https://www.linkedin.com/company/price-watch-ai/
????????: https://www.facebook.com/people//61568490385598/
???????: https://x.com/pricewatchai
???????: https://www.price-watch.ai/