


The HDPE Price Trend in Q2 2026 has shown a sharp increase across major global markets due to rising raw material costs, supply disruptions, higher transportation expenses, and uncertainty in the energy sector.
High-density polyethylene (HDPE) is widely used in packaging, plastic containers, pipes, household products, industrial applications, and many other everyday items. Because it is closely linked to the petrochemical industry, changes in crude oil, naphtha, and ethylene prices can directly affect its market value.
During the second quarter of 2026, tensions involving Iran and the United States and disruptions around the Strait of Hormuz created serious concerns about the movement of energy and petrochemical supplies. As a result, HDPE prices increased significantly in several regions before beginning to correct in June.
Please Submit Your Query For HDPE Price Trend, Market Analysis and Forecast: https://www.price-watch.ai/book-a-demo/
Global HDPE Market Overview in Q2 2026
The global HDPE market experienced an unusually strong upward movement during Q2 2026. The disruption of feedstock supplies from the Middle East affected production costs and international trade. The Strait of Hormuz is an important route for energy and petrochemical shipments, so concerns about its closure increased uncertainty among producers, traders, and buyers.
Ethylene, one of the main raw materials used to produce HDPE, became considerably more expensive during the quarter. Higher naphtha costs also added pressure to production economics, particularly in regions that depend on imported feedstocks. Some petrochemical facilities reduced operating rates, while supply disruptions and force majeure declarations in parts of the Middle East tightened the availability of polymer products.
At the same time, freight and marine insurance costs increased on several shipping routes. Importers had to consider not only the higher price of HDPE but also the additional expense of bringing the material to their local markets.
These combined factors pushed prices higher across Asia, Europe, the Americas, and the Middle East. However, the increase was not identical everywhere. Local production levels, currency movements, import dependence, and downstream demand influenced how much prices changed in each market.
HDPE Prices Across Major Global Markets
The movement in HDPE prices during Q2 2026 reflected the different supply and demand conditions in individual countries. Several markets recorded increases exceeding 50%, while European markets experienced some of the strongest gains of the quarter.
In Saudi Arabia, export offers from Jeddah increased by approximately 37% to 39% across selected HDPE grades. Higher feedstock costs and tighter regional availability supported the increase. Exporters also redirected some material toward premium Asian markets, adding pressure to available export supplies. Prices began to ease in June, declining by around 5% as shipping conditions improved.
In India, imported HDPE offers from Saudi Arabia increased by approximately 42% to 44%, while domestic depot prices rose by around 33% to 41%. Higher international prices, increased freight and insurance expenses, and rupee depreciation contributed to the movement. In June, Saudi-linked import offers declined by approximately 8%, but domestic depot prices edged up by around 1% to 2%. This difference showed how local inventory conditions and currency movements can influence domestic prices even when international markets begin to soften.
The United States recorded a strong increase, with selected HDPE export offers from Houston rising by approximately 55% to 64%. Higher ethylene costs and strong export demand supported the market. In June, prices eased by around 12% to 13% as the reopening of the Strait of Hormuz helped reduce feedstock pressure.
Brazil and Mexico also experienced significant increases because both markets were affected by higher US export prices. HDPE import offers in Brazil rose by approximately 56% to 62%, while prices in Mexico increased by around 61%. Higher freight expenses, insurance premiums, and currency pressure added to the cost of imported material. Both markets recorded a correction of around 12% in June.
Europe experienced some of the largest price increases during the quarter. In Belgium, selected HDPE offers rose by approximately 74% to 77%. Germany recorded an increase of around 73%, while Italy and France experienced gains of approximately 72% and 71%, respectively. High ethylene contract prices, expensive naphtha, and reduced operating rates at several petrochemical facilities tightened supply. In June, prices in these European markets eased by approximately 14% to 16% as feedstock costs began to moderate.
Asian markets also remained under pressure. In China, Saudi-origin import offers increased by approximately 36% to 38%, while selected domestic grades rose by around 30% to 33%. South Korean export offers increased by approximately 39% to 40%, supported by higher naphtha costs and export demand. Vietnam recorded an increase of approximately 43% to 44% for selected Saudi-origin imports. In June, import prices in China and South Korea declined by around 6%, while Vietnam recorded a smaller correction of approximately 4%.
These figures demonstrate that the HDPE market experienced a broad-based increase during Q2 2026, although the scale of the movement depended on regional supply conditions and the cost of imported material.
Key Factors Driving the HDPE Price Trend
- Higher Ethylene and Naphtha Costs
Ethylene is a major building block in HDPE production, making its price an important factor in determining polymer costs. When ethylene prices rise, producers often face higher manufacturing expenses and may increase their selling offers to protect margins.
During Q2 2026, disruptions to feedstock movements and uncertainty surrounding Middle Eastern energy supplies pushed ethylene and naphtha costs higher. These increases affected producers in both importing and exporting countries. Even manufacturers with relatively stable production faced pressure when replacement feedstocks became more expensive.
- Geopolitical Tensions and Supply Disruptions
Geopolitical tensions involving Iran and the United States created uncertainty across the petrochemical supply chain. Concerns about the Strait of Hormuz affected shipping expectations and reduced confidence in the regular movement of energy and polymer-related feedstocks.
When buyers become concerned about future availability, they may purchase material earlier than planned or increase safety stocks. This behaviour can add pressure to an already tight market. Producers and traders may also become more cautious about offering large volumes when transportation routes are uncertain.
- Freight and Insurance Expenses
Transportation costs play an important role in the final price of imported HDPE. Even when a producer's selling price remains unchanged, higher freight charges and marine insurance premiums can increase the landed cost for buyers.
During the quarter, shipping-related expenses added to the cost of HDPE imports in several regions. This was particularly important for countries that depend heavily on overseas supplies. The combined effect of higher export prices and transportation expenses made it more expensive for converters to secure raw materials.
- Production Constraints and Limited Availability
Reduced operating rates at some petrochemical facilities and regional supply disruptions tightened the availability of HDPE. When production falls while buyers continue to require material, sellers generally gain greater pricing power.
The impact was visible in parts of Europe and Asia, where feedstock scarcity and operating constraints affected domestic supply. Some buyers also looked for alternative suppliers, increasing competition for material available in international markets.
- Currency Movements and Local Market Conditions
Currency changes can influence the cost of imported polymers. When a country's currency weakens against the US dollar, importers may have to pay more in local currency even if the international selling price changes only slightly.
India's market illustrated this effect during Q2 2026. Domestic depot prices continued to edge higher in June even as Saudi-linked import offers declined. Local producer supply discipline and currency depreciation helped explain why domestic and imported material did not follow exactly the same direction.
HDPE Price Chart: Understanding the Q2 2026 Movement
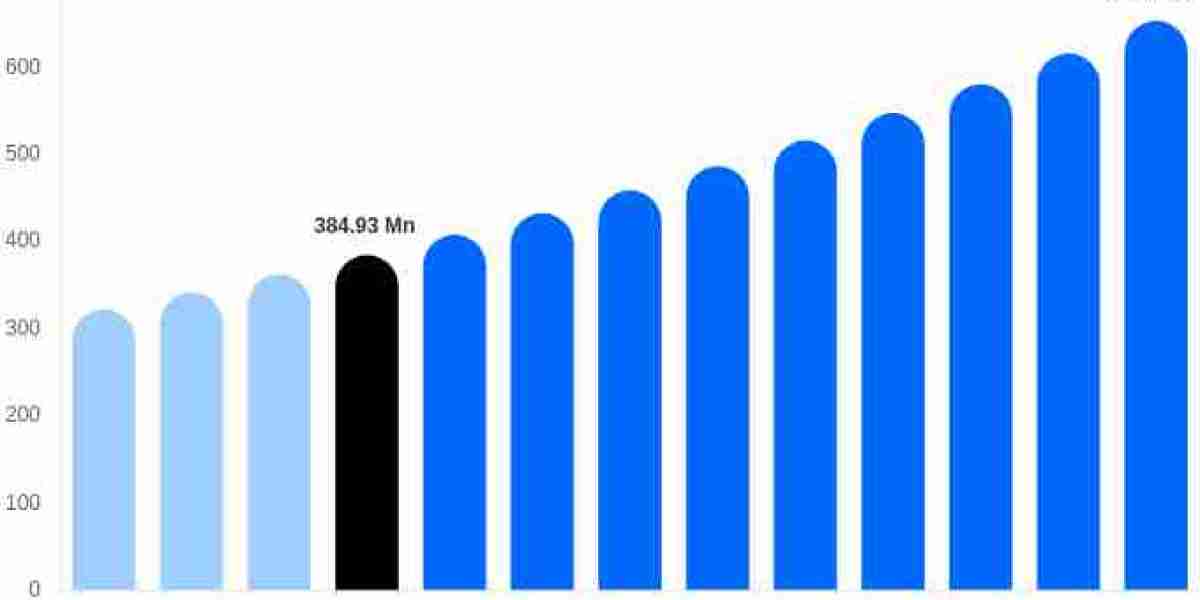
The HDPE Price Chart for Q2 2026 shows a steep upward movement during the quarter, followed by a correction in June across most of the major markets covered in the data.
The strongest increases were recorded in Europe, particularly Belgium, where selected prices rose by approximately 74% to 77%. Germany followed with an increase of around 73%, while Italy and France recorded gains of approximately 72% and 71%. These movements reflected expensive feedstocks, reduced production rates, and tight regional availability.
The Americas also experienced significant increases. Selected HDPE export offers from the United States rose by approximately 55% to 64%, while import offers in Brazil increased by around 56% to 62%. Mexico recorded an increase of approximately 61%, reflecting its close connection to US export pricing.
In Asia, Saudi-linked import offers increased by approximately 36% to 44% across the selected markets of China, India, and Vietnam. South Korean export prices rose by around 39% to 40%. India's domestic depot prices increased by approximately 33% to 41%, showing the effect of international pricing pressure on local trade.
June brought a change in direction. Prices declined by approximately 12% to 13% in the United States, around 12% in Brazil and Mexico, and approximately 14% to 16% in Belgium, Germany, Italy, and France. Saudi Arabia recorded a correction of around 5%, while selected import prices in China and South Korea declined by approximately 6%.
India followed a different pattern. Imported offers declined by around 8%, but domestic depot prices increased by approximately 1% to 2%. This divergence highlights the importance of checking the market, grade, location, and price basis before comparing HDPE values.
Overall, the chart indicates that the quarter's price increase was driven largely by supply-side pressure rather than a uniform rise in demand. The June correction suggests that prices can respond quickly when shipping conditions and feedstock availability begin to improve.
HDPE Price Index: What the Market Signals
The HDPE Price Index provides a useful way to understand the overall direction of the market. Instead of focusing on one transaction or one location, an index can help buyers and sellers monitor price movements over time and compare changes across regions.
During Q2 2026, the index direction was strongly upward across the major markets covered in the available data. Rising feedstock costs, reduced supply availability, and higher transportation expenses created a common upward trend. However, the size of the increase varied between countries.
The June correction introduced a new phase in the market. Improved shipping conditions and easing feedstock pressure reduced prices in many regions. This did not mean that all earlier increases were immediately reversed. In several markets, prices remained considerably higher than they had been before the quarterly surge.
India's domestic market again showed why index interpretation requires care. Imported material became less expensive in June, while domestic depot prices continued to rise slightly. A single global indicator may therefore fail to describe every local market accurately.
For buyers, following the index can help identify whether a price increase reflects a broader market movement or a local issue. For manufacturers and distributors, it can support purchasing decisions, budgeting, inventory planning, and discussions with suppliers. The actual index value should always be assessed alongside its methodology, grade coverage, location, and reporting period.
Impact on HDPE Buyers and Plastic Manufacturers
The sharp increase in HDPE prices created challenges for manufacturers that use the polymer in packaging, containers, pipes, and other plastic products. When raw material costs rise quickly, businesses may find it difficult to adjust their selling prices at the same speed.
For smaller manufacturers, the increase can put pressure on working capital. They may need to spend more money to maintain the same level of production, while customers may resist immediate price increases for finished goods.
Inventory planning also becomes more complicated during periods of uncertainty. Purchasing too little material can create a risk of production interruptions, but purchasing too much at unusually high prices can lead to losses if the market corrects.
The June decline in many markets offered some relief, but buyers still needed to consider whether the reduction was temporary or part of a longer adjustment. Businesses that monitor supplier offers, freight expenses, currency movements, and downstream demand are better positioned to respond to these changes.
HDPE Price Forecast: What to Watch After Q2 2026
The outlook following Q2 2026 will depend on how quickly supply chains return to more stable conditions. The June correction provides an indication that prices can ease when transportation improves and feedstock pressure declines. However, it does not guarantee that every market will continue moving downward.
One important factor is the future direction of ethylene and naphtha prices. If feedstock costs remain lower and production improves, HDPE producers may face less pressure to maintain elevated selling offers. Better availability could also reduce the need for buyers to compete aggressively for limited material.
Shipping conditions will remain important. Any renewed disruption to major transportation routes could increase freight costs and create fresh concerns about supply. In that situation, international offers could strengthen again, particularly in markets that rely heavily on imports.
Demand will also influence the direction of prices. If packaging, construction, and industrial activity remain firm, buyers may continue purchasing material even at higher prices. If downstream demand weakens, producers could find it harder to pass on additional costs.
Currency movements will be another factor for import-dependent markets such as India. Even if global HDPE prices decline, a weaker local currency can limit the reduction in landed costs.
For the coming quarters, buyers should therefore avoid relying on a single prediction. Tracking raw material costs, import offers, producer inventories, freight rates, currency changes, and actual purchasing demand can provide a more balanced view of the market.
Conclusion
The HDPE Price Trend in Q2 2026 reflected an exceptional period of cost pressure and supply uncertainty. Prices increased sharply across Europe, the Americas, the Middle East, and Asia as geopolitical tensions, disruptions around the Strait of Hormuz, higher ethylene and naphtha costs, and increased freight expenses affected the polymer supply chain.
Belgium, Germany, Italy, and France recorded particularly strong increases, while the United States, Brazil, and Mexico also experienced substantial gains. India saw sharp increases in both imported and domestic markets, followed by different price movements in June.
The June correction showed that improved logistics and easing feedstock pressure can help reduce market prices. However, local supply conditions, exchange rates, and producer pricing decisions continued to influence individual regions.
For businesses that depend on HDPE, regularly reviewing price movements, market indicators, and supply conditions is essential for managing costs and planning purchases. A clear understanding of the price chart, index direction, and factors behind market changes can help buyers make more informed decisions in a market where prices may change quickly.
Please Submit Your Query For HDPE Price Trend, Market Analysis and Forecast: https://www.price-watch.ai/book-a-demo/
About Price Watch™
Price Watch™ is an India-based, independent raw material price reporting agency that provides real-time price forecasts and data-driven insights into global raw material markets. Price Watch™ specializes in tracking raw material prices, analyzing market trends, and delivering timely updates on plant shutdowns, supply disruptions, capacity expansions, and demand-supply dynamics. The Price Watch™ platform empowers manufacturers, traders, and procurement professionals to make faster, smarter decisions. Leveraging AI-powered forecasting and over a decade of historical data, Price Watch™ transforms market volatility into actionable opportunity.
Futura Tech Park,
C Block, 8th floor 334,
Old Mahabalipuram Road,
Sholinganallur, Chennai, Tamil Nadu, Pincode - 600119.
????????: https://www.linkedin.com/company/price-watch-ai/
????????: https://www.facebook.com/people//61568490385598/
???????: https://x.com/pricewatchai
???????: https://www.price-watch.ai/